PRACTICAL EXAM
17IT115
- Task-1:
Dataset Description using Orange tool.
What is need to be done to improve the accuracy of classification result of the given dataset? Get the maximum classification accuracy possible by performing following methods.
-->Pre-processing
o Encoding
o Normalization
o Missing value handling
o Feature Selection
Data-set Description:-
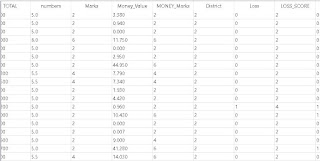
The dataset was made available through 2 csv files – audit_risk and trial. The audit_risk has 27 columns and trial has 18 columns. The 27 columns in audit_risk file are the following:
- LOCATION_ID – Unique ID of the city or province
- numbers - Historical discrepancy score
- Money_Value - Amount of money involved in misstatements in the past audits
- SCORE_MV, Risk_D - These columns can be derived from the Money_Value
- District_Loss - Historical risk score of a district in the last 10 years
- PROB – probability of District_Loss
- Risk_E – It is the product of District_Loss and PROB
- History - Average historical loss suffered by firm in the last 10 years
- Prob – Probability of Historical Loss score
- Risk_F – It is the product of History and prob
Money_value has null data-set
Find the Maximum data insights by plotting Bar chart, Boxplot, Pie Plot, Stack Plot using PowerBI dashboard visualization.
Fig 5 Power BI Dashboard
Dashboard with pie- chart, bar graph & stack chart
Colab Link:- https://colab.research.google.com/drive/1sKYAeJcdJrhcdwGd4Ak200BF5LFgyjJq


Comments
Post a Comment